
*Above graphic compliments of Epsilontheory.com
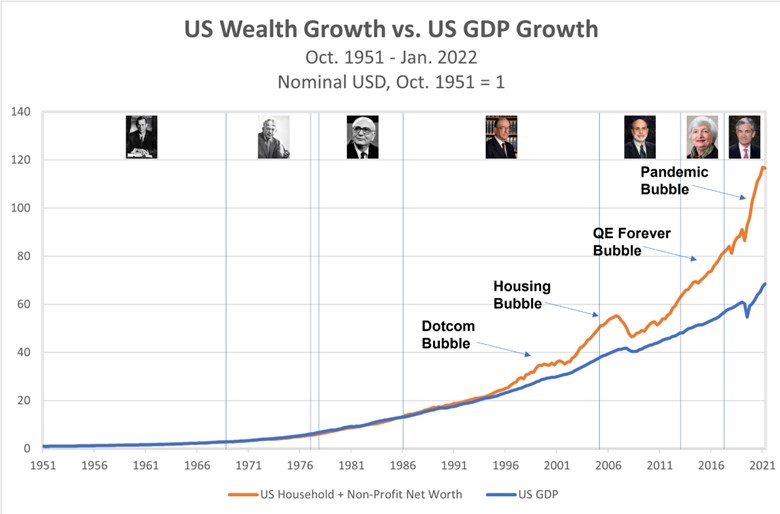
I don’t recall ever starting a previous Insight by jumping immediately into graphs, but these two graphs – telling the same story but in a different format – largely speak for themselves. Over time, the wealth of an economy (society) cannot grow faster than the growth (output) of that economy. Basically, wealth tracks GDP. It is possible to have time periods where wealth accumulates at a higher or lower rate than GDP growth, but this is through pulling future demand into the present (stimulus), or repaying that pulled forward demand when the future arrives. This isn’t economic philosophy or theory; it is simply math. I won’t get into the details now, but am happy to separately go through the math for anyone that would like to see it. Even without math though, it just makes sense. The value of something (assets) is tied to the returns it provides (now or in the future). Returns provided is GDP. Lower returns today mean less investment into productivity and/or less spending, both of which result in lower future profits, which in turn hurts the value of the asset.
The first graph shows how closely GDP and wealth moved in unison for the first four decades following WWII. Wealth started to comparatively accelerate in the 1990s when…the Federal Reserve first started pushing the boundaries of its dual mandate using monetary policies in ways it hadn’t previously. As we all know, that bastardized use of monetary policy accelerated from Greenspan into Bernanke, Yellen, and now Powell, who seems to have realized the mistakes of the past two decades and is intent on correcting them.
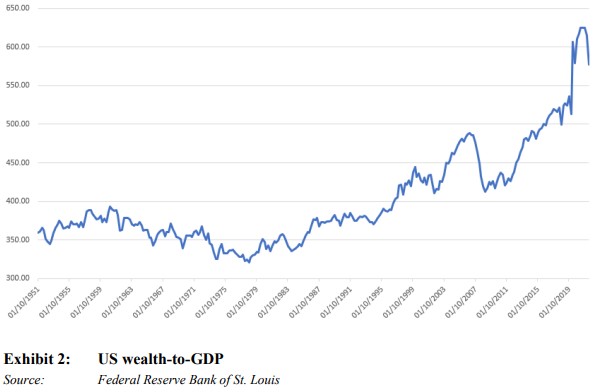
The second chart shows the same information, but as a percentage of wealth to GDP over the same time period. This chart shows that the average wealth of the country is ~390% of GDP. Some of you are scribbling on scratch paper to calculate what appears to indicate a 4 multiple and a 25% capitalization rate. But this is not so. GDP is more akin to revenue than profit. Additionally, there is a substantial amount of wealth held in non-investment residential real estate, which doesn’t have a direct return on investment, though it eventually finds its way into GDP in a diluted manner. Last year the wealth to GDP ratio hit 625%, a relative 60% above the long-term mean. The stock market correction we are currently experiencing has lowered this ratio below 600%. A meaningful drop in wealth, but minimal in the scheme of a reversion to the mean. It should be mentioned that while data since the 1950s is being used in these graphs, the same relationship between wealth and GDP can be documented going back hundreds of years to when such data was first collected, or can be reasonably approximated.
It isn’t really fair to lay this entire variance at the feet of the Federal Reserve. Federal and state governments also have had their hand in creating this divergence. A recent example is the American Rescue Plan signed by the President in March 2021. The output gap from the COVID-19 shutdown had already been fully covered by previous spending bills (the wisdom of those earlier bills could also be debated). This bill was nothing more than money that went straight to the balance sheets of the recipients. But like all government spending, it has to be paid from somewhere. The government borrowed the money with its accompanying interest expense, and the repayment was kicked down the road to be a burden on those that likely weren’t beneficiaries of the excess.
It is easy to look at these charts and assume the nation’s wealth, or rather the wealth of the citizens of the nation, needs to fall dramatically to bring the historical ratios back in line. This is certainly a possibility, but isn’t a surety. The other way this situation could be resolved is through the growth of the economy with a relative stagnation of wealth. Five years of 10% nominal GDP growth without asset valuation growth would shrink the gap by a relative ~90%. Ten percent sounds like a big number, but we are talking nominal here, not real. GDP had a nominal growth rate of 10% in 2021, and that was before inflation really kicked in. Going back to 1948, the average nominal growth rate is 6.48%. While flat asset valuations over an extended period of time are hard to fathom, it has occurred at other points in our history. Everyone is familiar with the Great Depression, where the stock market didn’t recover to 1926 prices until 1950 (sandwiched around a huge run up and a massive sell off). The 1960s/1970s stagflation resulted in an essentially flat stock market between 1955 and 1988. While calculating the forecast differently, some well-respected investment groups, most specifically GMO, anticipated flat US equities performance over a ten-year period starting around the turn of the decade. While it is easy to point out their inaccuracy within a rally or consolidation, they have been impressively accurate over the rolling ten-year projections they have provided.
And… it is possible that it does require a fall in wealth, and quite possibly a large one. There is very little direct investment in bonds (1% of total wealth), so the carnage in the bond market over the past nine months hasn’t had a large impact on the total wealth (this does not include retirement accounts which also holds some percentage of bonds). The fall of the stock market did though, accounting for nearly the entirety of the reduction, equating to a wealth to GDP ratio below 600%. The cratering of crypto also reduced net worth, but at only ~2.5% of the size of the stock market. Thus, huge losses in crypto are minimal versus even moderate equity price decreases. A complete implosion of cryptos resulting in 100% loss would only be ~10% of the losses experienced in the stock market year-to-date.
Outside of retirement accounts, which generally include some combination of stocks and bonds, equity in our homes is by far the largest source of wealth in the United States. The average home has $300,000 of equity for a total home equity of almost $28 Trillion (with a “T”) against a total market value of ~$43 trillion, indicating a healthy loan-to-value across the entire market of only 35(This high level of equity is one reason why a market wide residential real estate crash is unlikely). For comparison, US GDP in 2021 was $23 Trillion, or less than the current residential real estate value in the US.
Calculating the wealth to GDP gap from the 2021 GDP, this indicates total US net worth of ~$112 trillion. If, as discussed above, investment values (and thus net worth) were to stay flat while GDP grew, the economy would need to grow to $29 Trillion to get back to the historical mean. This is a 26% increase in the size of the nominal economy. If, by comparison, the stock market stayed flat but real estate prices fell, it would indicate roughly a 14% decrease in residential home values and a 21% decrease in home equity.
It is impossible to hold particular inputs constant and have only one economic input impact the broader economic picture, but in a simulation where equities stayed flat and the economy didn’t grow, the housing market alone could bring this ratio back into line. Yes, it would be substantial wealth destruction, but mostly on paper. When you live in a house there is no added day-to-day utility (economic benefit) for a property being worth $500,000 or $600,000. And if the market values increase from $500,000 to $600,000 (or vice versa), the entire market does so and the sale of one home (and the associated utility the home produces) must be replaced by another home (and the associated utility). For particular individuals who are upsizing/downsizing or cashing out all-together, it matters, but for the economy more broadly, this would not be a bad rebalancing scenario.
But the stock market won’t stay flat, and the economy won’t completely stagnate. If the stock market falls further and/or the economy grows, then the required impact to housing is muted. Conversely, if the stock market increases in value and/or the economy contracts, then the impact to housing would need to be more severe. Commercial real estate is a very small percentage of total US wealth and thus has been excluded from these high-level analyses.
The combination of US equities is about 20% larger than the residential housing value. This indicates that holding other inputs constant, stocks would have to fall approximately 22% to bring the wealth to GDP ratio back into balance.
What does all this mean to me? Not a whole heck of a lot. Psychologically, I guess it is helpful to understand that there is likely more room downward in asset values; but outside of particular pockets (like what happened to crypto), our balance sheets shouldn’t completely implode. Most important, I need to remember the ultimate value of my balance sheet is the purchasing power it creates, mostly/preferably through the investment income it creates. If owning a rental house for income (or a stock for dividends, or an apartment building, or, or…) then the income produced is far more important than the market price of the property at any point in time. Falling asset prices may result in strengthened purchasing power.
It is also worth remembering that reversion to the mean usually means a snapback past the mean, but then an ensuing reversion (and so on). If the reversion continues past the mean and into negative territory, the pain will be greater than I outlined here. Important for me, and for Altus more broadly, is that in this potential scenario we don’t turn into turtles and withdraw into our shell, but instead take advantage of the situation to build a bigger and stronger portfolio.
If I was okay owning an asset at $X, I should be really excited to own it at $X – %.
Happy Investing.
